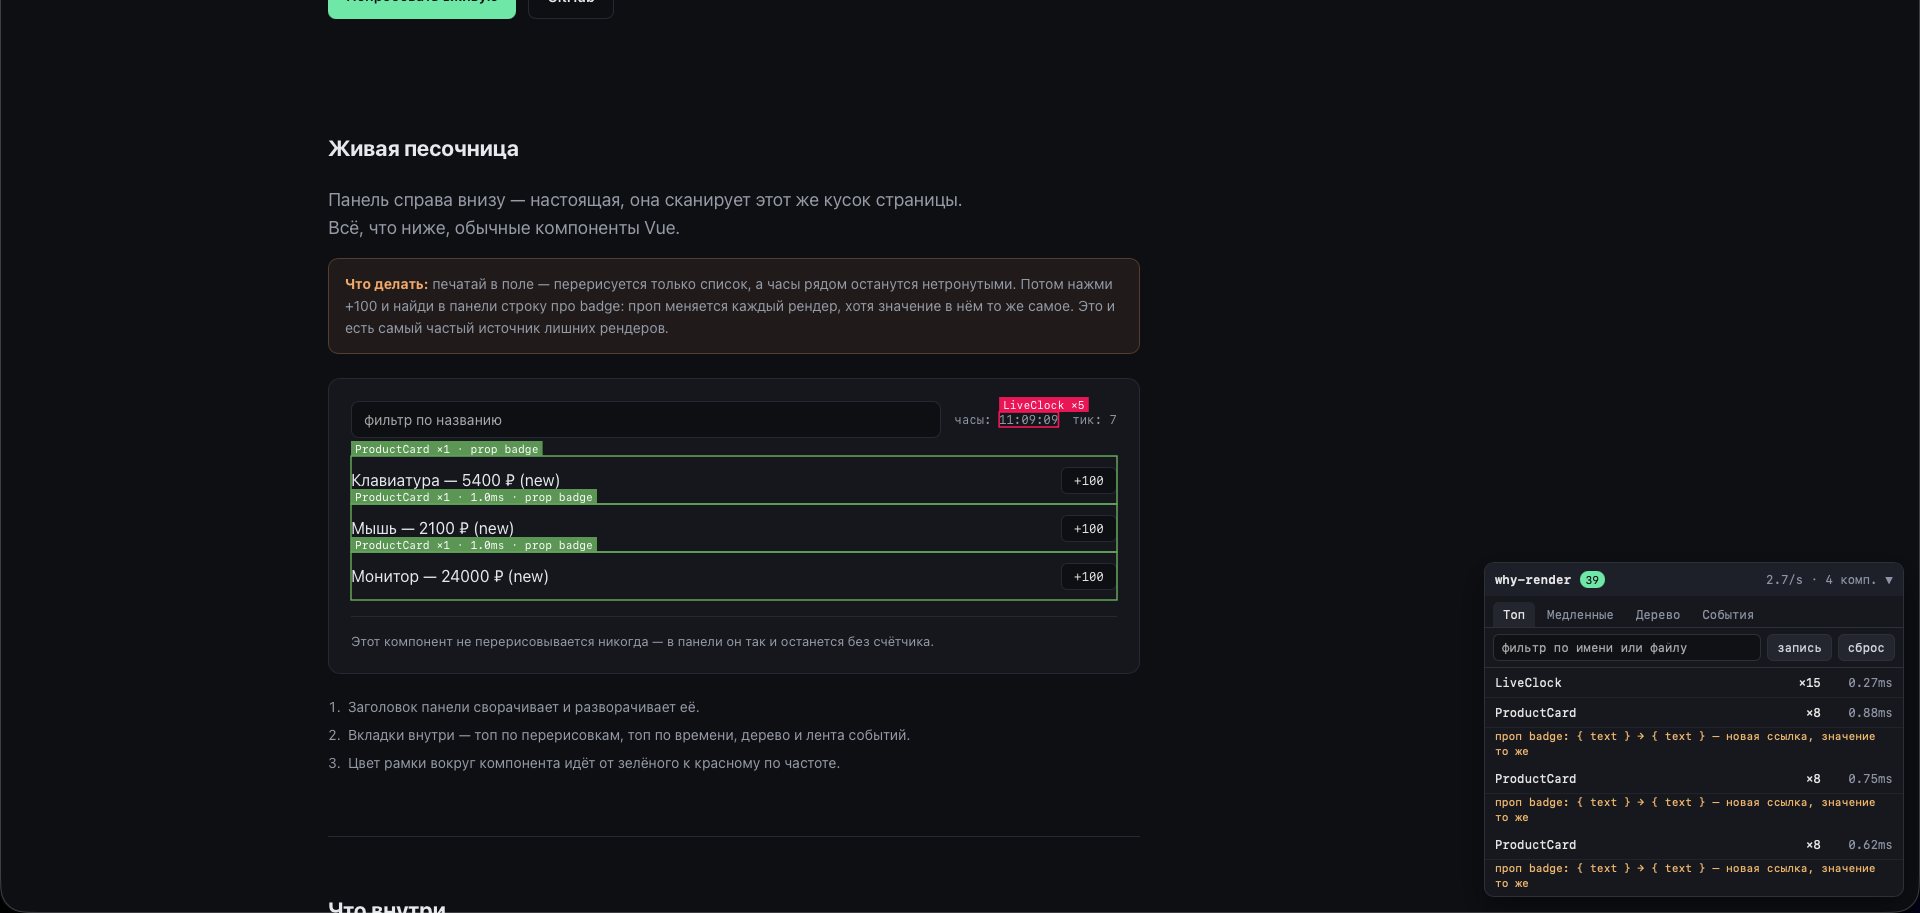
Existing tools can flash a border around a component that just updated. That's enough to notice a problem, but not to fix it: you're still left asking "what actually changed?"
It turns out Vue knows the answer and hands it over on its own. Almost nobody uses it. Below: how the renderTriggered hook works, why the raw event it gives you is unreadable, and three ways to break someone else's production build with a dev tool that isn't even supposed to run in production.
What was missing
Vue DevTools has a "Highlight updates" checkbox. The React ecosystem next door has react-scan. Both show you the same thing: this component re-rendered.
The problem is that knowing "it re-rendered" is useless on its own. You can already see the page twitching. The real question is always different: what exactly changed. Which prop, which ref, which store field. Without that, you sit there commenting out chunks of the template until you binary-search your way to the culprit.
In React there's no other way: reactivity works at the "the component re-rendered" level, so the cause has to be reconstructed by diffing props. Vue's reactivity is fine-grained, though. The framework knows exactly which dependency triggered the render.
And it tells you.
renderTriggered
Every component has a renderTriggered hook. Vue passes it an object:
{
  target,    // the object where the change happened
  type,      // set / add / delete / clear
  key,       // the key
  oldValue,  // value before
  newValue,  // value after
}
That's exactly the information I was missing. Register a global mixin, and every render comes with a reason.
Sounds like we're done. But the raw event is impossible to read.
The raw event is unreadable
Here's what you actually get in typical cases.
A ref. target is the ref object itself, and key is the string 'value'. So the report says "value changed". Thanks, very helpful.
The variable name only exists in the component's setupState. So you have to walk through it and find which key holds our target:
function findRefName(container, target) {
  const raw = toRaw(container)
  const descriptors = Object.getOwnPropertyDescriptors(raw)

  for (const key of Object.keys(descriptors)) {
    const descriptor = descriptors[key]
    if (!descriptor || typeof descriptor.get === 'function') continue

    const value = descriptor.value
    if (value === target) return key
    if (isRef(value) && toRaw(value) === target) return key
  }
  return null
}
There's a separate story about typeof descriptor.get === 'function' further down. That line didn't exist at first, and it cost a broken hydration.
A Pinia store. The store object has an $id. If it's a string, we're looking at a store, and the key should be shown as cart.items, not just items.
An array. key is a numeric index. Showing 3 means nothing; [3] is already readable.
Props. target === instance.props means a prop changed.
After all that processing, a line in the panel looks like this:
ProductCard ×7 · 2.4ms · badge
└─ prop badge: { text } → { text } — new reference, same value
The most useful line
That last part, "new reference, same value", is the whole reason I started this.
The classic case:
<ProductCard :badge="{ text: 'new' }" />Vue hoists a static literal into a constant, so this one is fine. But this one isn't:
<ProductCard :badge="makeBadge()" />Every parent render creates a new object with the same contents. For the child, that's a changed prop, so it re-renders. Every single time. A flashing border will show you that it re-rendered, but it won't tell you the literal in the parent's template is to blame.
This isn't caught through renderTriggered but separately, by diffing props between beforeUpdate and updated with a shallow equality check:
changes.push({
  key,
  oldValue: formatValue(oldValue),
  newValue: formatValue(newValue),
  referenceOnly: isShallowEqual(oldValue, newValue),
})
Pitfall one: a single reference to process.env broke prod
The first version detected the build mode by itself, like everyone does:
const isDev = process.env.NODE_ENV !== 'production'process doesn't exist in a browser bundle, but that's expected and easy to work around. Something else broke.
A user built their Nuxt project for production and got:
Unexpected token &&Inside our file. In a built bundle nobody had written by hand.
Here's what happened. @rollup/plugin-commonjs (which ships as part of Vite) scans modules and decides whether an ESM file is actually mixed CommonJS. A bare reference to process.env.NODE_ENV is one of the signals. The plugin decided our ESM was CJS and started rewriting it. The result was syntactically broken code.
The key part: everything built fine on my machine. The package's own build was green, tests passed, the tarball installed. It only broke in the consumer's app, inside their plugin pipeline.
My first attempt at a fix was reading it through globalThis.process. Didn't help: any mention of process in any form was enough to trigger the same mechanism.
In the end I removed mode detection entirely. The package doesn't guess the environment. Turning it off in production is the caller's job, but with a static flag:
// Nuxt
if (!import.meta.dev) return
const { default: VueWhyRender } = await import('vue-why-render')

// Vite
if (import.meta.env.DEV) {
  const { default: VueWhyRender } = await import('vue-why-render')
  app.use(VueWhyRender)
}
This way the bundler strips out not only the call but the import itself, so the package physically never ends up in the production bundle. For a dev tool, that's more honest than any auto-detection.
Pitfall two: Cyrillic in comments
With process fixed, the consumer's prod build broke again. Same error.
It turned out the same plugin, while rewriting code, counts offsets in bytes, not characters. And our comments and UI strings were in Russian. Every Cyrillic letter takes two bytes in UTF-8. The offsets drifted, insertions landed in the middle of tokens, and the output was garbage.
The fix was straightforward: post-process the published bundle with esbuild.
await build({
  entryPoints: [file],
  outfile: file,
  allowOverwrite: true,
  bundle: false,
  format,
  target: 'es2022',
  charset: 'ascii',        // all non-ASCII becomes \uXXXX
  minifyWhitespace: true,
  minifySyntax: true,
  minifyIdentifiers: false, // leave names alone so the file stays readable
  legalComments: 'none',    // comments are stripped
})
Comments get stripped, non-ASCII turns into escape sequences, and byte offsets match character offsets. The prod build works.
The lesson I took away: if your package is published to npm, keep only ASCII in the bundle. Not for aesthetics, but because you don't control which plugins will be rewriting your code on someone else's side.
Pitfall three: hydration crashed
The third case is the nastiest, because it wasn't the build that broke, it was the runtime.
On a test run against a real Nuxt project with hundreds of components, hydration crashed whenever reason tracking was on.
The culprit was that same ref name lookup. The first version enumerated setupState the usual way, and the usual enumeration evaluates getters. setupState holds the app's computeds. So we were evaluating someone else's computeds right inside renderTriggered, at a moment they weren't designed for. One of them accessed data that didn't exist yet and took hydration down with it.
Hence that line in the code above:
if (!descriptor || typeof descriptor.get === 'function') continueWe read strictly through descriptors and never touch getters.
On top of that, every hook is wrapped in a guard:
function safe(label, fn) {
  try {
    fn()
  }
  catch (error) {
    if (!warnedAboutCrash) {
      warnedAboutCrash = true
      console.warn(`[vue-why-render] ${label} failed, scanning continues:`, error)
    }
  }
}
The principle is simple: a debugging tool has no right to crash the app it's debugging. An error inside our hook would surface as a render error in someone else's component, and the developer would go hunting for a bug in their own code.
Why not renderTracked
The neighbouring renderTracked hook fires on every read of a reactive value. Sounds tempting: the full dependency picture. In practice, it's thousands of calls per second in an average app, and there's nothing left to profile: the tool becomes the main consumer of time.
Only renderTriggered is used.
What it costs
The tool is dev-only for three reasons, and none of them is about playing it safe:
renderTriggeredonly works in Vue's dev build. In production the hook isn't called at all, so there's nothing to measure.- The callback fires on every reactivity trigger. If you're profiling timings specifically, turn off reason tracking:
trackReasons: false. - The global mixin adds hooks to every component in the app.
What came out of it
npm i -D vue-why-renderA border around the re-rendered component, coloured from green to red by frequency. A panel with top lists by re-render count and by time, a component tree, and an event feed. Clicking a row opens the SFC in your editor through the dev server. The UI is available in English, Russian and Chinese via the locale option.
No runtime dependencies, MIT license.
- Source: https://github.com/dadashi44/vue-why-render
- npm: https://www.npmjs.com/package/vue-why-render
- Live playground, and the panel on it is the real thing: https://dadashi44.github.io/vue-why-render/
What it doesn't do
- It doesn't replace Vue DevTools flame graphs or browser traces: it shows what re-rendered and why, not where the time went inside a render.
- It doesn't work in production, and that's not a limitation, it's by design.
- It doesn't support Vue 2: there's no
renderTriggeredthere, and I'm not willing to dig intovm._watcherfor an ecosystem that reached end of life in 2023.
If you run it on a large app and it breaks, please open an issue. So far exactly one real project has been through it, and that's its weakest spot.